1QFY2020 Result Update | Automobile
July 30, 2019
Maruti Suzuki India
BUY
CMP
`5,558
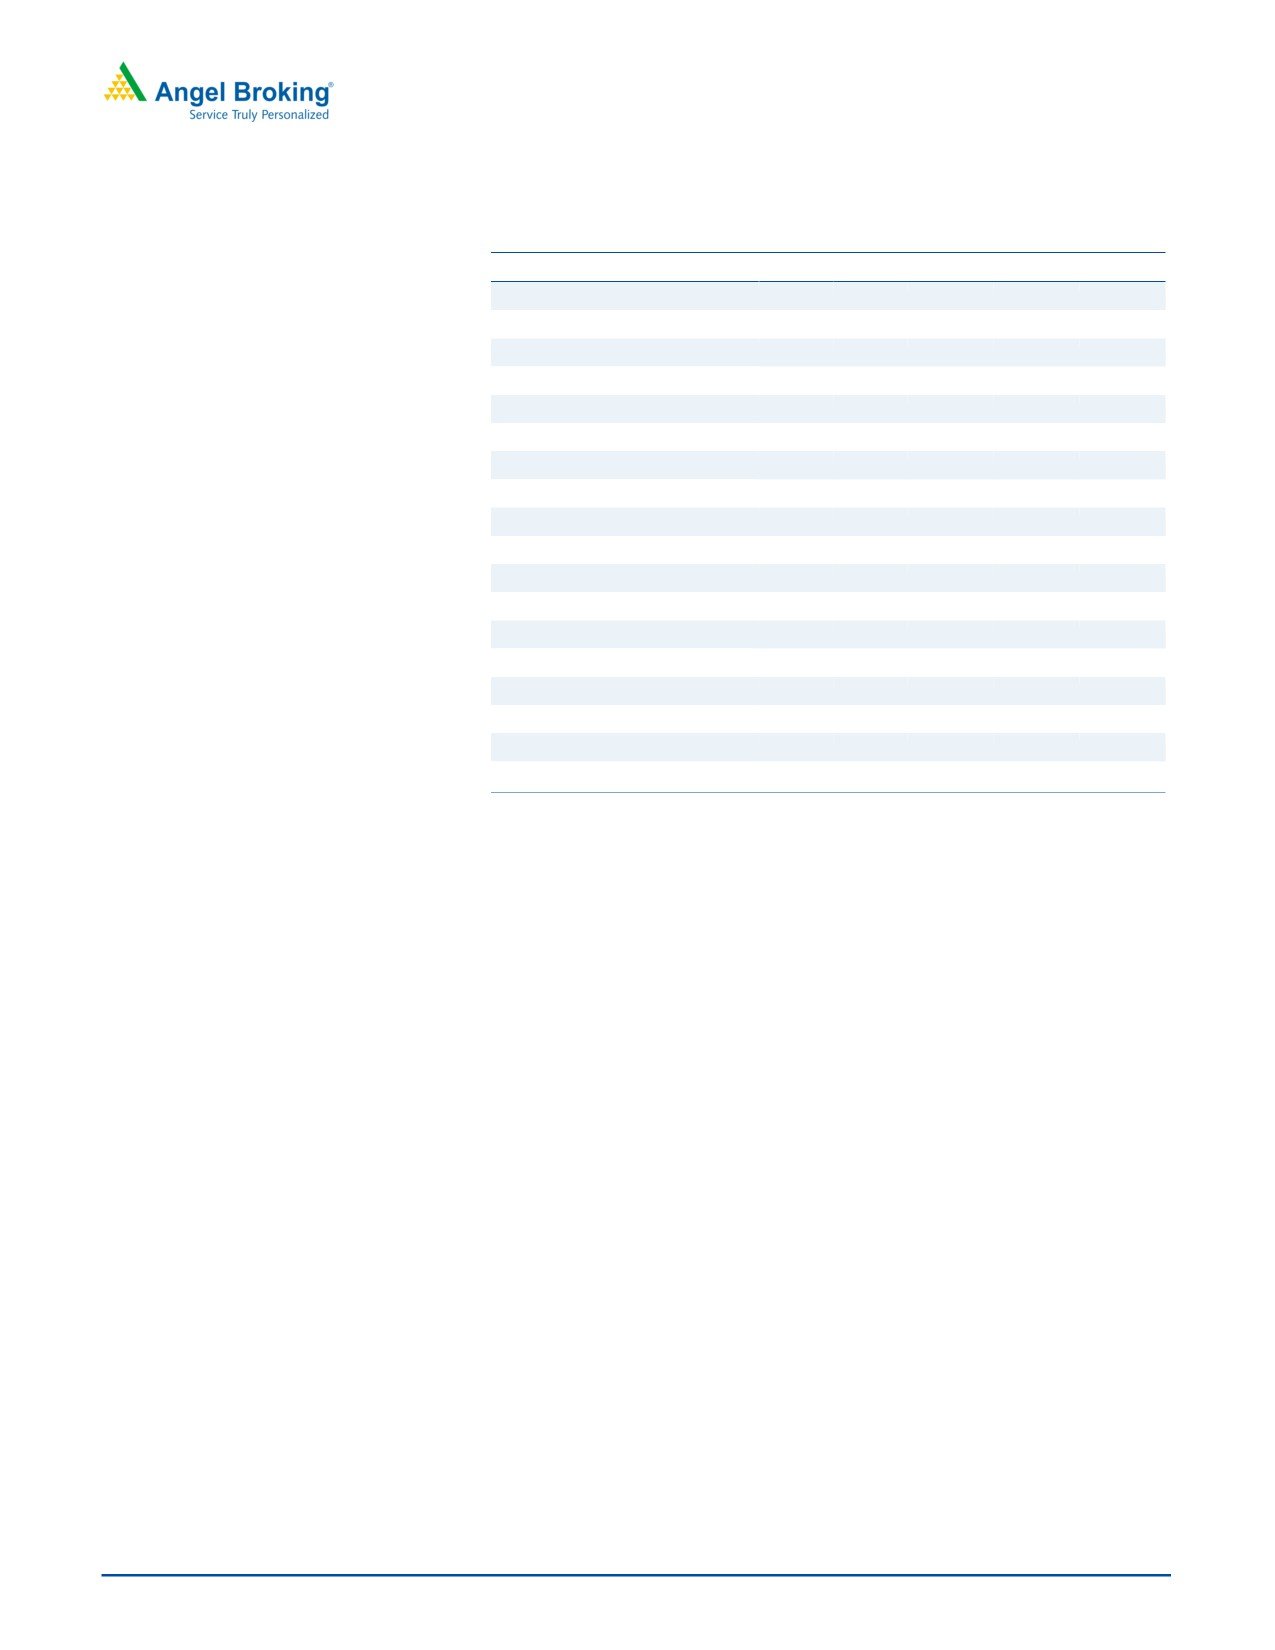
Performance Update
Target Price
`7,783
Y/E March (` cr)
1QFY20 2QFY19
% yoy
4QFY19
% qoq
Investment Period
12 months
Net sales
19,720
22,459
(12.2)
21,459
(8.1)
EBITDA
2,048
3,351
(38.9)
2,263
(9.5)
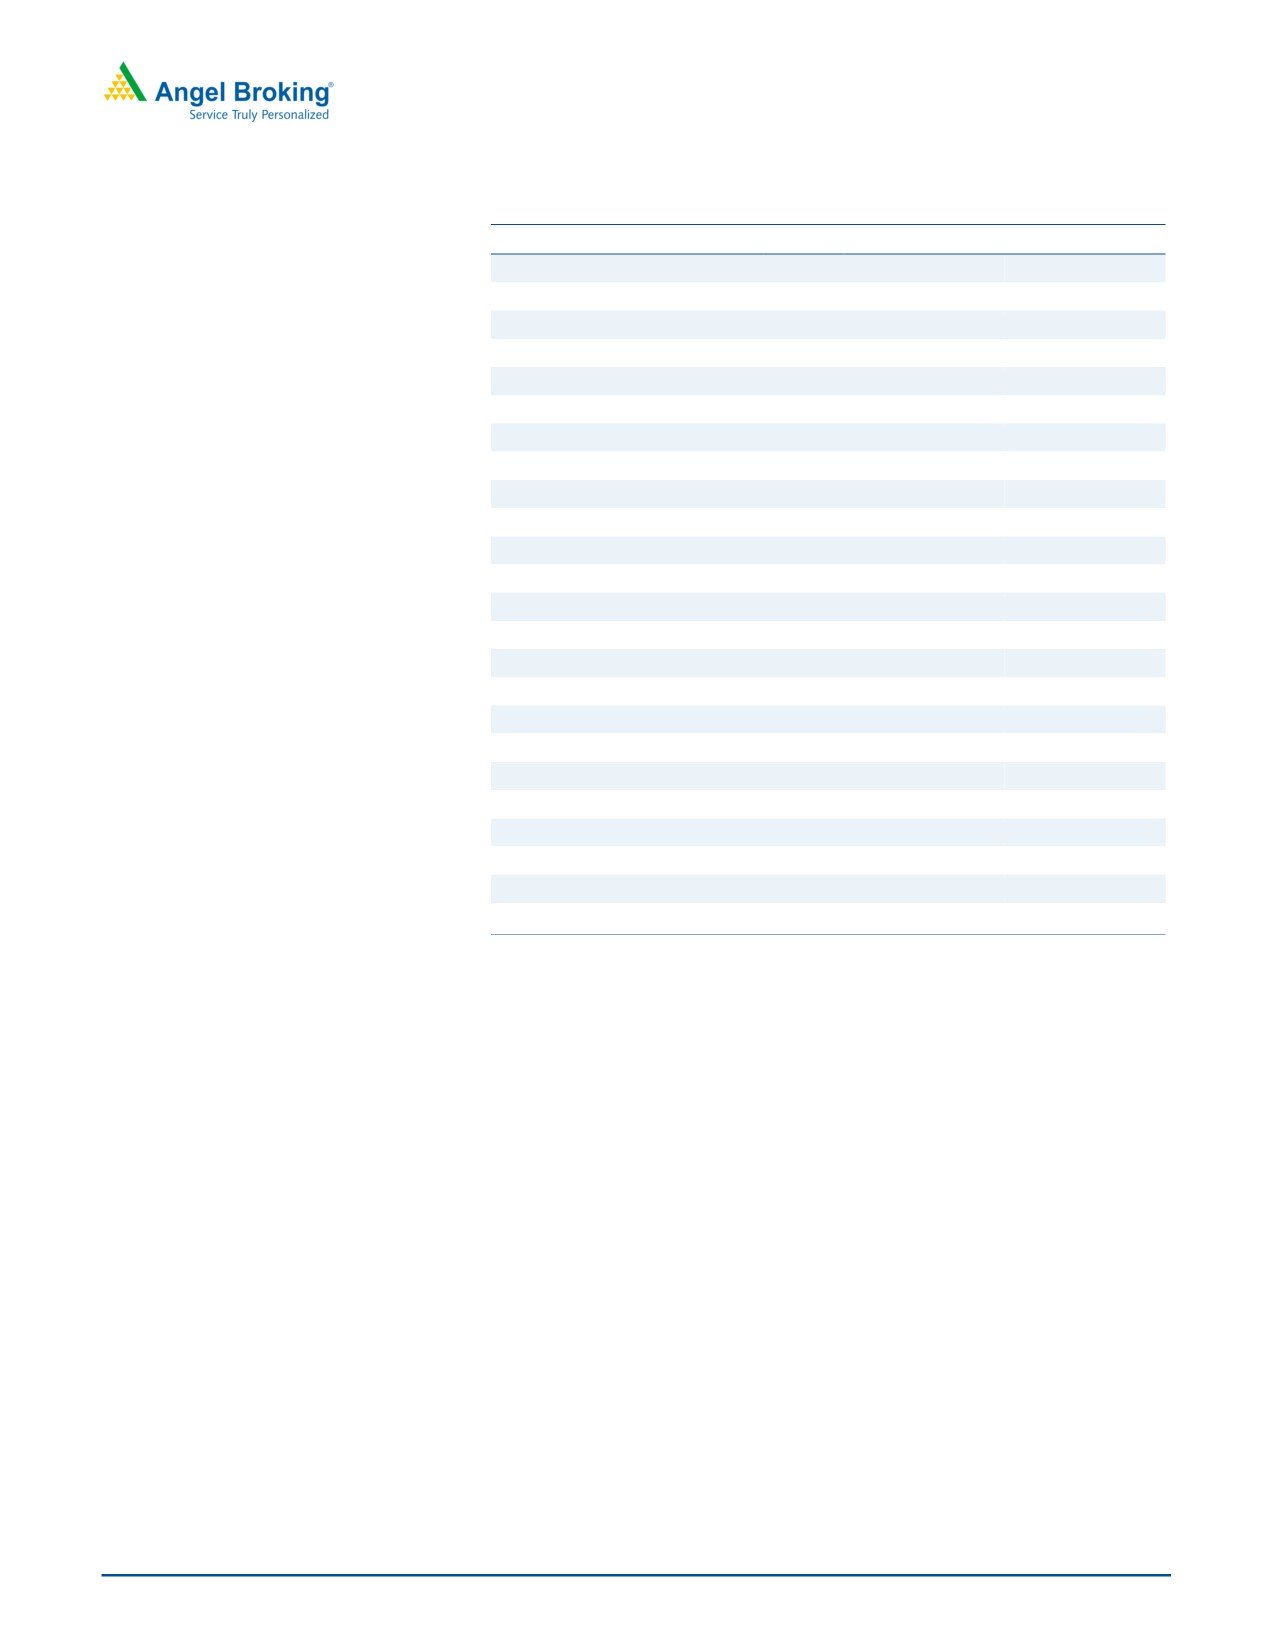
Stock Info
Sector
Automobile
EBITDA margin (%)
10.4
14.9
(454bp)
10.5
(16bp)
Market Cap (` cr)
1,67,889
Adjusted PAT
1,436
1,975
(27.3)
1,796
(20.1)
Net Debt (` cr)
(37,534)
Source: Company, Angel Research
Beta
1.0
For 1QFY2020, Maruti Suzuki India (MSIL) posted below expectation results both
52 Week High / Low
9,590/5540
Avg. Daily Volume
59,018
on top-line and bottom-line fronts. MSIL’s standalone top-line registered a decline
Face Value (`)
5
of ~12% yoy to `19,720cr on the back of volume de-growth of 18%. Moreover,
BSE Sensex
37,686
the company’s operating margins contracted by 454bps yoy. On the standalone
Nifty
11,189
bottom-line front, MSIL reported de-growth of ~27% yoy to `1,436cr on the back
Reuters Code
MRTI.BO
of lower sales and poor operating performance.
Bloomberg Code
MSIL.IN
Top-line falls on declining volumes: MSIL’s standalone top-line de-grew by ~12%
Shareholding Pattern (%)
yoy to `19,720cr. Overall volume growth declined by ~18% yoy, mainly due to
Promoters
56.2
subdued demand in the urban and rural markets. The company’s management
MF / Banks / Indian Fls
7.2
refrained from giving any volume guidance for the full year considering the future
FII / NRIs / OCBs
23.2
uncertainty. Recently, SIAM has revised its guidance for FY2020 and estimated a
Indian Public / Others
13.5
decline of 2-3%.
Subdued volumes and poor operating performance mar profitability: On the
Abs. (%)
3m 1yr 3yr
operating front, the company reported contraction in margins, down 454bps yoy
Sensex
(3.4)
0.5
34.3
at 10.4%. Operating margin was impacted mainly due to higher sales expense,
MSIL
(10.3)
(38.2) 29.4
unfavorable product mix and lower capacity utilization. On the standalone bottom-
line front, MSIL reported de-growth of ~27% yoy to `1,436cr.
Outlook and Valuation: During the last four quarters, the company’s volume
growth has remained subdued mainly due to overall slowdown in economy, which
affected the buying sentiment. However, we believe that any revival in auto industry
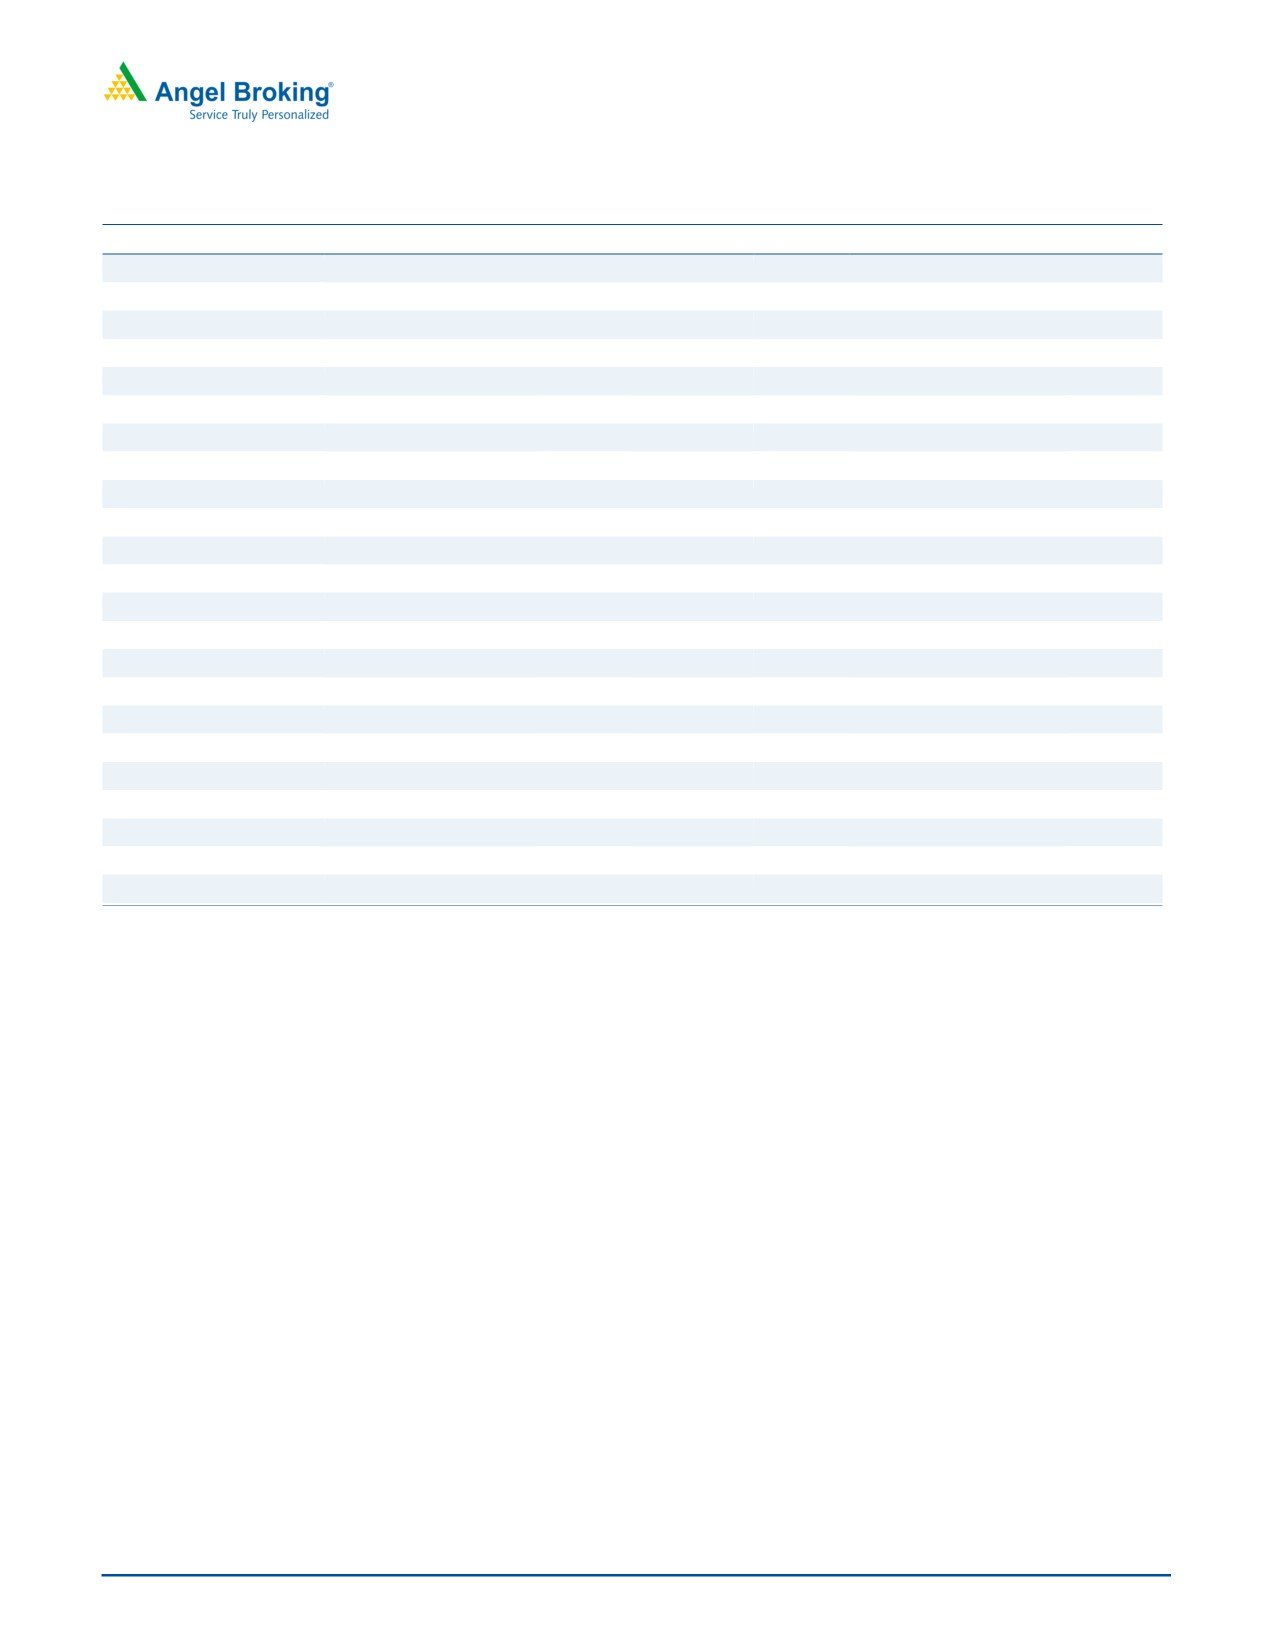
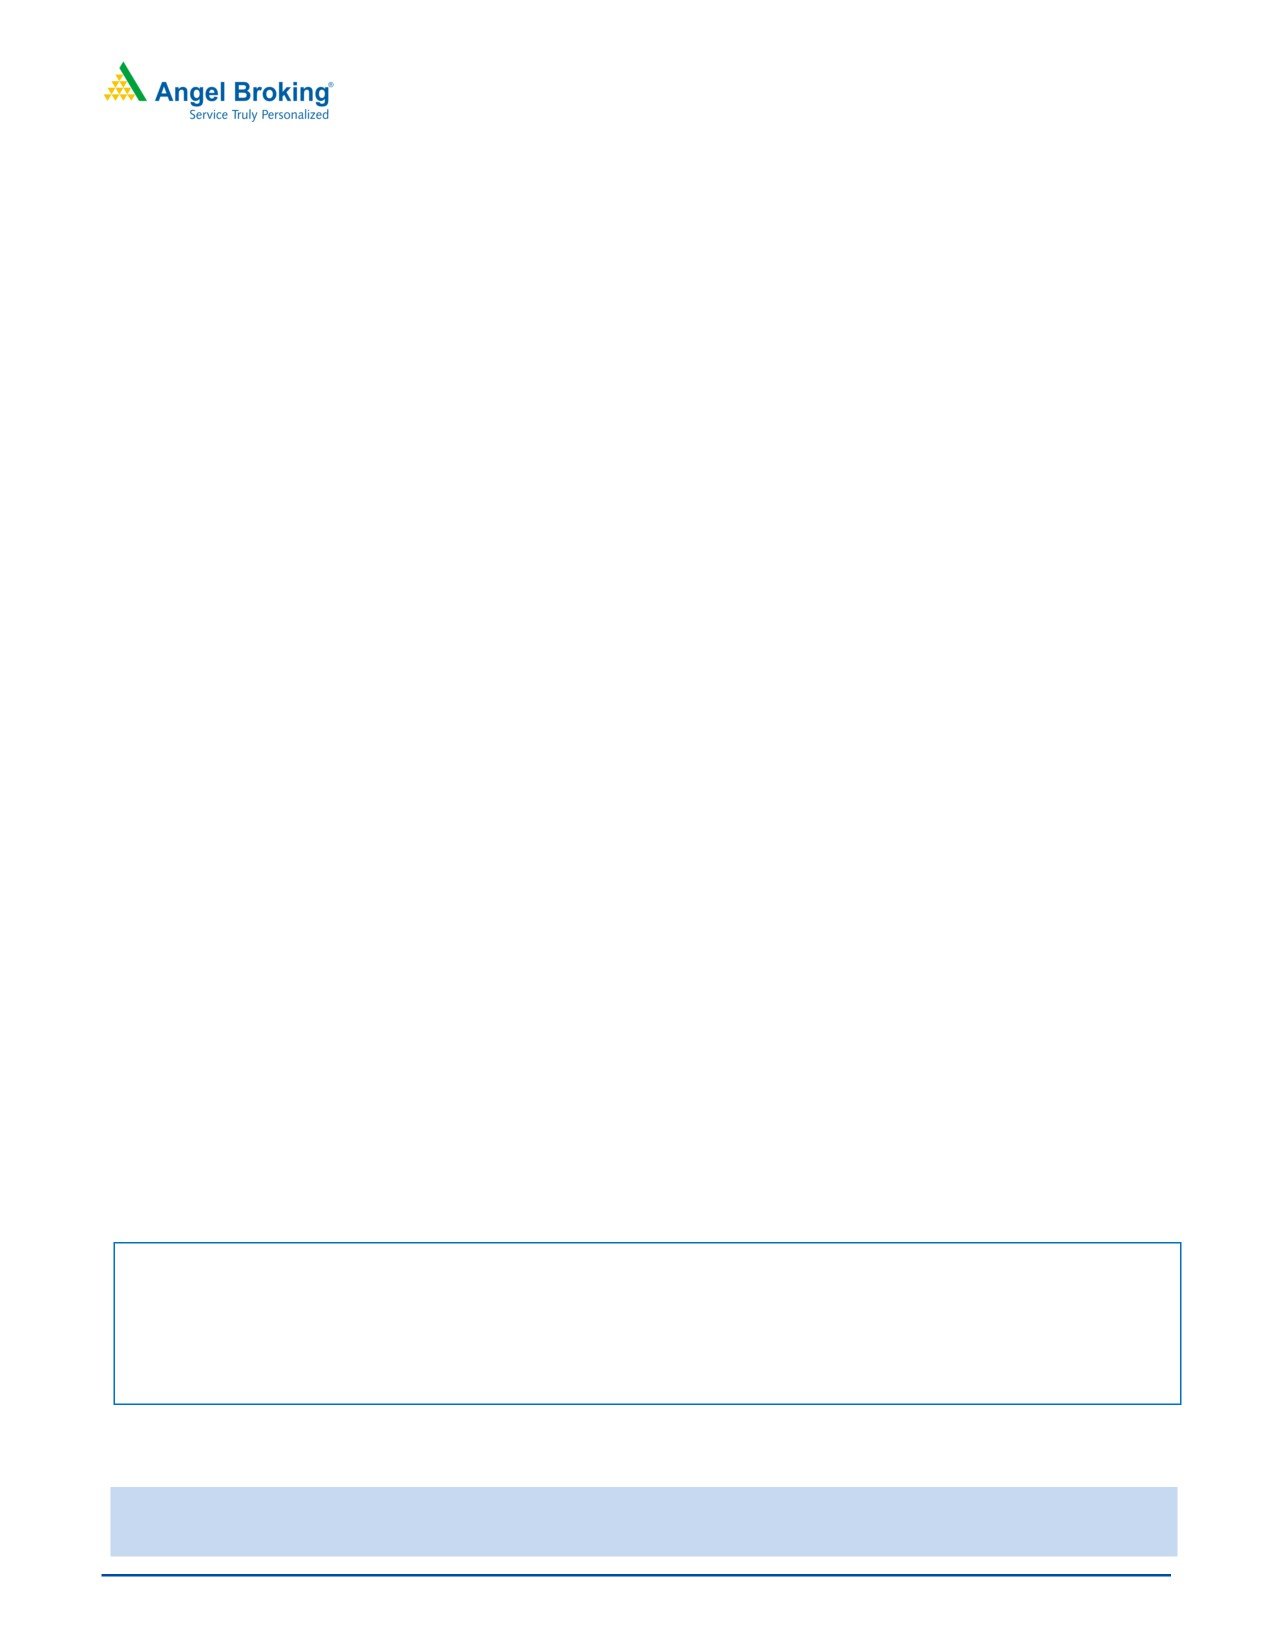
Price Chart
would benefit Maruti on the back of its leadership position, diversified portfolio and
12000
strong brand & distribution network. Considering the above factors, we maintain
10000
our Buy recommendation on MSIL with Target Price of `7,783.
8000
6000
Key Financials
4000
Y/E March (` cr)
FY2018
FY2019
FY2020E
FY2021E
2000
Net sales
79,809
86,069
84,280
90,169
0
% chg
17.2
7.8
(2.1)
7.0
Adj. Net profit
7,881
7,651
6,443
7,123
% chg
4.9
(2.9)
(15.8)
10.5
Source: Company, Angel Research
EBITDA margin (%)
15.1
12.8
11.9
12.6
EPS (`)
261.0
253.3
213.4
235.8
Research Analyst
P/E (x)
21.3
21.9
26.1
23.6
Amarjeet S Maurya
P/BV (x)
3.9
3.6
3.4
3.2
022-40003600 Ext: 6831
RoE (%)
18.5
16.2
12.9
13.5
RoCE (%)
21.8
16.9
13.3
14.4
EV/Sales (x)
1.7
1.5
1.5
1.4
EV/EBITDA (x)
10.9
11.8
12.7
10.9
Source: Company, Angel Research Note
Please refer to important disclosures at the end of this report
1
Maruti Suzuki India Ltd| 1QFY2020 Result Update
Exhibit 1: 1QFY2020 Performance
Y/E March (` cr)
1QFY20
1QFY19
% yoy
4QFY19
% qoq
FY2019
FY2018
% chg
Net Sales
19,720
22,459
(12.2)
21,459
(8.1)
86,020
81,994
4.9
Consumption of RM
14091
15,502
(9.1)
15424
(8.6)
60,254
57,207
5.3
(% of Sales)
71.5
69.0
71.9
70.0
69.8
Staff Costs
859
765
12.3
817
5.2
3,255
2,834
14.9
(% of Sales)
4.4
3.4
3.8
3.8
3.5
Other Expenses
2,722
2,841
(4.2)
2,956
(7.9)
11,512
9,892
16.4
(% of Sales)
13.8
12.6
13.8
13.4
12.1
Total Expenditure
17,672
19,108
(7.5)
19,196
(7.9)
75,021
69,933
7.3
Operating Profit
2,048
3,351
(38.9)
2,263
(9.5)
10,999
12,062
(8.8)
OPM
10.4
14.9
10.5
12.8
14.7
Interest
55
21
164.3
9
521.6
76
346
(78.1)
Depreciation
919
720
27.6
810
13.4
3019
2758
9.5
Other Income
836
272
207.7
868
(3.6)
2561
2046
25.2
PBT (excl. Ext Items)
1,911
2,882
(33.7)
2,312
(17.4)
10,466
11,003
(4.9)
Ext (Income)/Expense
-
-
-
-
-
PBT (incl. Ext Items)
1,911
2,882
(33.7)
2,312
(17.4)
10,466
11,003
(4.9)
(% of Sales)
9.7
12.8
10.8
12.2
13.4
Provision for Taxation
475
907
(47.6)
517
(8.0)
2,965
3,282
(9.6)
(% of PBT)
24.9
31.5
22.3
28.3
29.8
Reported PAT
1,436
1,975
(27.3)
1,796
(20.1)
7,501
7,722
(2.9)
PATM
7.3
8.8
8.4
8.7
9.4
Minority Interest After NP
Reported PAT
1,436
1,975
(27.3)
1,796
(20.1)
7,501
7,722
(2.9)
Source: Company, Angel Research
July 30, 2019
2
Maruti Suzuki India Ltd| 1QFY2020 Result Update
Outlook and Valuation
During the last four quarters, the company’s volume growth has remained subdued
mainly due to overall slowdown in economy, which affected the buying sentiment.
However, we believe that any revival in auto industry would benefit Maruti on the
back of its leadership position, diversified portfolio and strong brand & distribution
network. Considering the above factors, we maintain our Buy recommendation on
MSIL with Target Price of `7,783.
Downside risks to our estimates
Strong launches and facelift of existing models by competitors like Hyundai
Motors, M&M, Ford, etc. can grab the market share from MSIL.
Slowdown of economy can impact the overall buying sentiment of automobile
segment.
Company Background
Maruti Suzuki, a subsidiary of Suzuki Motor Corporation of Japan, is India's largest
passenger car company, accounting for over 45% of the domestic car market. The
company offers 14 brands spanning across cars, UV and MPV segments. WagonR,
Swift, DZire, Baleno, Brezza and Ciaz are the most popular models and dominate
the market in their respective segments. It has three manufacturing facilities in
Gurgaon and Manesar with installed capacity of c.1.55mn units. It has the most
extensive distribution network among all PV companies in India.
July 30, 2019
3
Maruti Suzuki India Ltd| 1QFY2020 Result Update
Profit & Loss Statement
Y/E March (` cr)
FY2017
FY2018
FY2019
FY2020E
FY2021E
Net Sales
68,085
79,809
86,069
84,280
90,169
% chg
18.2
17.2
7.8
(2.1)
7.0
Total Expenditure
57,727
67,746
75,065
74,250
78,807
Raw Material
46,742
54,986
60,264
60,681
64,921
Personnel
2,360
2,863
3,285
3,203
2,795
Others Expenses
8,624
9,897
11,516
10,366
11,091
EBITDA
10,358
12,063
11,003
10,029
11,361
% chg
16.5
16.5
(8.8)
(8.9)
13.3
(% of Net Sales)
15.2
15.1
12.8
11.9
12.6
Depreciation& Amortisation
2,604
2,760
3,021
3,359
3,734
EBIT
7,754
9,304
7,982
6,670
7,627
% chg
27.8
20.0
(14.2)
(16.4)
14.3
(% of Net Sales)
11.4
11.7
9.3
7.9
8.5
Interest & other Charges
89
346
76
95
95
Other Income
2,462
2,209
2,562
2,500
2,500
(% of PBT)
24.3
19.8
24.5
27.5
24.9
Recurring PBT
10,127
11,167
10,468
9,075
10,032
% chg
33.5
10.3
(6.3)
(13.3)
10.5
Tax
2,616
3,286
2,973
2,632
2,909
(% of PBT)
25.8
29.4
28.4
29.0
29.0
PAT (reported)
7,511
7,881
7,495
6,443
7,123
Extraordinary Items
-
-
-
-
-
ADJ. PAT
7,511
7,881
7,651
6,443
7,123
% chg
36.6
4.9
(2.9)
(15.8)
10.5
(% of Net Sales)
11.0
9.9
8.9
7.6
7.9
Basic EPS (`)
248.7
261.0
253.3
213.4
235.8
Fully Diluted EPS (`)
248.7
261.0
253.3
213.4
235.8
% chg
36.6
4.9
(2.9)
(15.8)
10.5
July 30, 2019
4
Maruti Suzuki India Ltd| 1QFY2020 Result Update
Balance Sheet
Y/E March (` cr)
FY2017
FY2018
FY2019
FY2020E FY2021E
SOURCES OF FUNDS
Equity Share Capital
151
151
151
151
151
Reserves& Surplus
36,924
42,408
47,039
49,858
52,753
Shareholders Funds
37,075
42,559
47,190
50,009
52,904
Total Loans
484
121
158
158
158
Deferred Tax Liability
1,110
921
921
921
921
Total Liabilities
38,684
43,617
48,284
51,104
53,998
APPLICATION OF FUNDS
Gross Block
18,680
21,458
25,660
28,960
32,260
Less: Acc. Depreciation
5,370
8,069
11,090
14,449
18,184
Net Block
13,311
13,389
14,570
14,511
14,077
Capital Work-in-Progress
1,252
2,132
2,132
2,132
2,132
Investments
29,151
36,123
37,504
40,504
43,504
Current Assets
8,247
8,604
8,257
9,084
10,890
Inventories
3,264
3,160
3,301
3,233
3,459
Sundry Debtors
1,203
1,465
2,358
2,309
2,964
Cash
24
74
188
340
860
Loans & Advances
2,129
2,013
430
1,264
1,353
Other Assets
1,628
1,892
1,980
1,938
2,254
Current liabilities
13,881
16,950
17,676
18,437
19,913
Net Current Assets
(5,634)
(8,346)
(9,419)
(9,352)
(9,023)
Deferred Tax Asset
604
319
319
319
319
Mis. Exp. not written off
-
-
-
-
-
Total Assets
38,684
43,617
48,284
51,104
53,998
July 30, 2019
5
Maruti Suzuki India Ltd| 1QFY2020 Result Update
Consolidated Cashflow Statement
Y/E March (` cr)
FY2017
FY2018
FY2019
FY2020E FY2021E
Profit before tax
10127
11167
10468
9075
10032
Depreciation
2604
2760
3021
3359
3734
Change in Working Capital
2192
2808
1187
86
191
Interest / Dividend (Net)
52
278
76
95
95
Direct taxes paid
(2323)
(3056)
(2973)
(2632)
(2909)
Others
(2370)
(2168)
0
0
0
Cash Flow from Operations
10282
11788
11778
9983
11143
(Inc.)/ Dec. in Fixed Assets
(3236)
(3885)
(3574)
(3300)
(3300)
(Inc.)/ Dec. in Investments
(5937)
(4417)
(1381)
(3000)
(3000)
Cash Flow from Investing
(9173)
(8302)
(4955)
(6300)
(6300)
Issue of Equity
0
0
0
0
0
Inc./(Dec.) in loans
253
(363)
37
0
0
Dividend Paid (Incl. Tax)
(1057)
(2266)
(3020)
(3624)
(4228)
Interest / Dividend (Net)
(331)
(807)
(3727)
93
(95)
Cash Flow from Financing
(1136)
(3436)
(6710)
(3531)
(4323)
Inc./(Dec.) in Cash
(27)
51
114
152
520
Opening Cash balances
51
24
74
188
340
Closing Cash balances
24
74
188
340
860
July 30, 2019
6
Maruti Suzuki India Ltd| 1QFY2020 Result Update
Key Ratio
Y/E March
FY2017
FY2018
FY2019
FY2020E FY2021E
Valuation Ratio (x)
P/E (on FDEPS)
22.3
21.3
21.9
26.1
23.6
P/CEPS
16.6
15.8
16.0
17.1
15.5
P/BV
4.5
3.9
3.6
3.4
3.2
Dividend yield (%)
1.3
1.4
1.8
2.2
2.5
EV/Sales
2.0
1.7
1.5
1.5
1.4
EV/EBITDA
13.4
10.9
11.8
12.7
10.9
EV / Total Assets
3.6
3.0
2.9
2.6
2.4
Per Share Data (`)
EPS (Basic)
248.7
261.0
253.3
213.4
235.8
EPS (fully diluted)
248.7
261.0
253.3
213.4
235.8
Cash EPS
334.9
352.3
348.2
324.6
359.5
DPS
75.0
80.0
100.0
120.0
140.0
Book Value
1,227.7
1,409.3
1,562.6
1,655.9
1,751.8
Returns (%)
ROCE
20.6
21.8
16.9
13.3
14.4
Angel ROIC (Pre-tax)
92.5
143.5
82.7
71.5
87.7
ROE
20.3
18.5
16.2
12.9
13.5
Turnover ratios (x)
Asset Turnover (Gross Block)
3.6
3.7
3.4
2.9
2.8
Inventory / Sales (days)
17
14
14
14
14
Receivables (days)
6
7
10
10
12
Payables (days)
49
53
53
58
58
Working capital cycle (ex-cash) (days)
(25)
(31)
(29)
(34)
(32)
Source: Company, Angel Research
July 30, 2019
7
Maruti Suzuki India Ltd| 1QFY2020 Result Update
Research Team Tel: 022 - 39357800
DISCLAIMER
Angel Broking Limited (hereinafter referred to as “Angel”) is a registered Member of National Stock Exchange of India Limited, Bombay
Stock Exchange Limited and Metropolitan Stock Exchange Limited. It is also registered as a Depository Participant with CDSL and Portfolio
Manager and Investment Adviser with SEBI. It also has registration with AMFI as a Mutual Fund Distributor. Angel Broking Limited is a
registered entity with SEBI for Research Analyst in terms of SEBI (Research Analyst) Regulations, 2014 vide registration number
INH000000164. Angel or its associates has not been debarred/ suspended by SEBI or any other regulatory authority for accessing
/dealing in securities Market. Angel or its associates/analyst has not received any compensation / managed or co-managed public
offering of securities of the company covered by Analyst during the past twelve months.
This document is solely for the personal information of the recipient, and must not be singularly used as the basis of any investment
decision. Nothing in this document should be construed as investment or financial advice. Each recipient of this document should make
such investigations as they deem necessary to arrive at an independent evaluation of an investment in the securities of the companies
referred to in this document (including the merits and risks involved), and should consult their own advisors to determine the merits and
risks of such an investment.
Reports based on technical and derivative analysis center on studying charts of a stock's price movement, outstanding positions and
trading volume, as opposed to focusing on a company's fundamentals and, as such, may not match with a report on a company's
fundamentals. Investors are advised to refer the Fundamental and Technical Research Reports available on our website to evaluate the
contrary view, if any
The information in this document has been printed on the basis of publicly available information, internal data and other reliable sources
believed to be true, but we do not represent that it is accurate or complete and it should not be relied on as such, as this document is for
general guidance only. Angel Broking Limited or any of its affiliates/ group companies shall not be in any way responsible for any loss
or damage that may arise to any person from any inadvertent error in the information contained in this report. Angel Broking Limited
has not independently verified all the information contained within this document. Accordingly, we cannot testify, nor make any
representation or warranty, express or implied, to the accuracy, contents or data contained within this document. While Angel Broking
Limited endeavors to update on a reasonable basis the information discussed in this material, there may be regulatory, compliance, or
other reasons that prevent us from doing so.
This document is being supplied to you solely for your information, and its contents, information or data may not be reproduced,
redistributed or passed on, directly or indirectly.
Neither Angel Broking Limited, nor its directors, employees or affiliates shall be liable for any loss or damage that may arise from or in
connection with the use of this information.
Disclosure of Interest Statement
Maruti Suzuki India
1. Financial interest of research analyst or Angel or his Associate or his relative
No
2. Ownership of 1% or more of the stock by research analyst or Angel or associates or relatives
No
3. Served as an officer, director or employee of the company covered under Research
No
4. Broking relationship with company covered under Research
No
Ratings (Returns):
Buy (> 15%)
Accumulate (5% to 15%)
Neutral (-5 to 5%)
Reduce (-5% to -15%)
Sell (< -15%)
July 30, 2019
8